“Jesse Livermore” has a thorough and convincing new article in which he argues that return on equity (ROE) matters more than profit margins, because it is high ROEs—not high profit margins—that lure new entrants into a market and drive competition. As Livermore says,
“Corporations seek to maximize their total profits…The mistake we’re making here is to assume that corporations “compete” for profit margins. They don’t. Profit margins have no value at all. What has value is a return. The decision to expand into the market of a competitor and seek additional return is not a decision driven by the expected profit margin, the expected return relative to the anticipated quantity of sales. Rather, it’s a decision driven instead by the expected ROE, the expected return relative to the amount of capital that will have to be invested, put at risk, in order to earn it.”
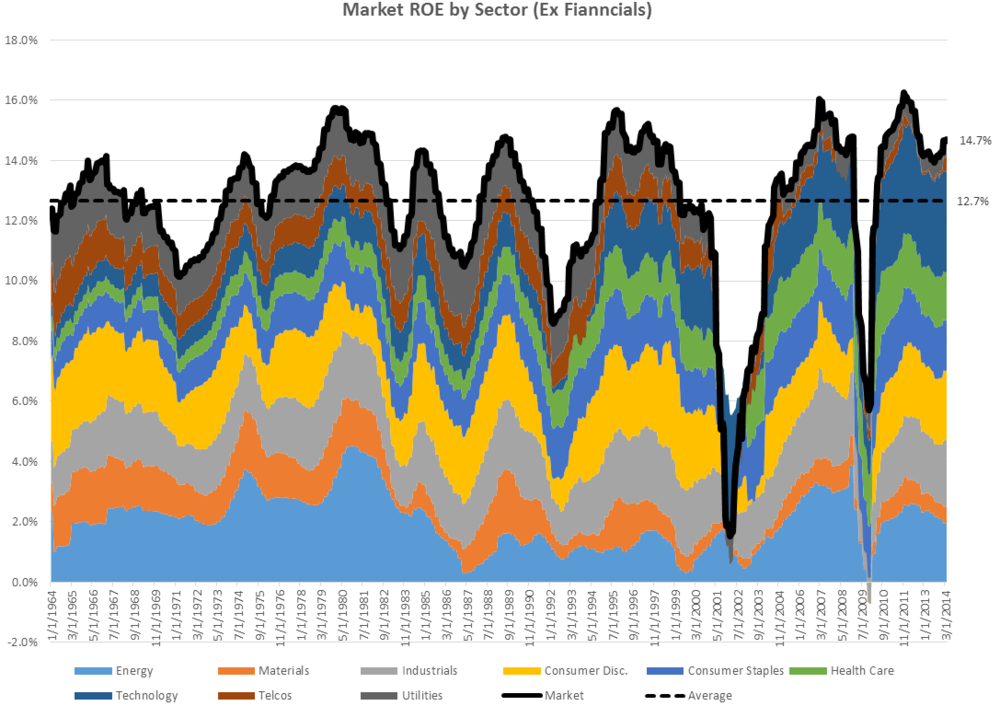
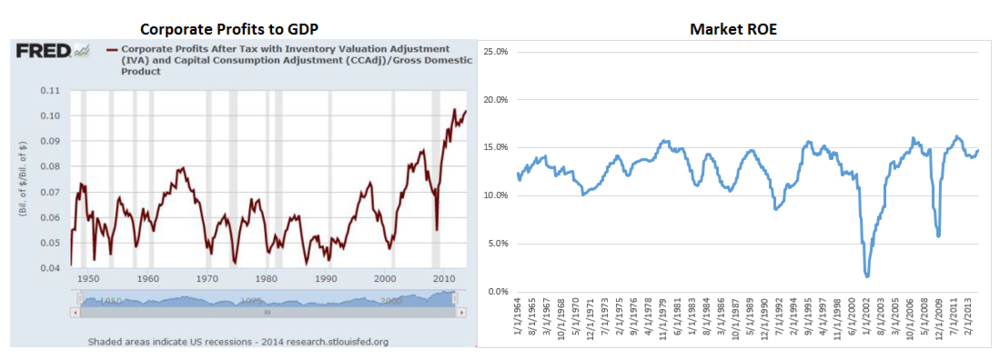
Indeed, market ROE has exhibited strong mean reversion over the past 50 years. What follows is a breakdown of contribution by sector to the overall market’s ROE. We are above the long term average, but current levels look completely normal relative to past ROE “peaks.”
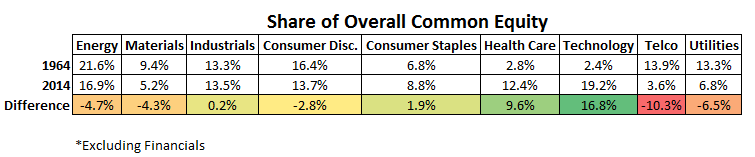
I wrote an article about the changing composition of market profit margins, and the story for ROE is very similar. 50 years ago, technology and health care stocks represented a small percentage of the market’s ROE. In 1964, the two sectors represented just 5% of the markets total common equity (book value). But today, these two sectors combine to represent nearly 32% of the non-financial market’s common equity value.
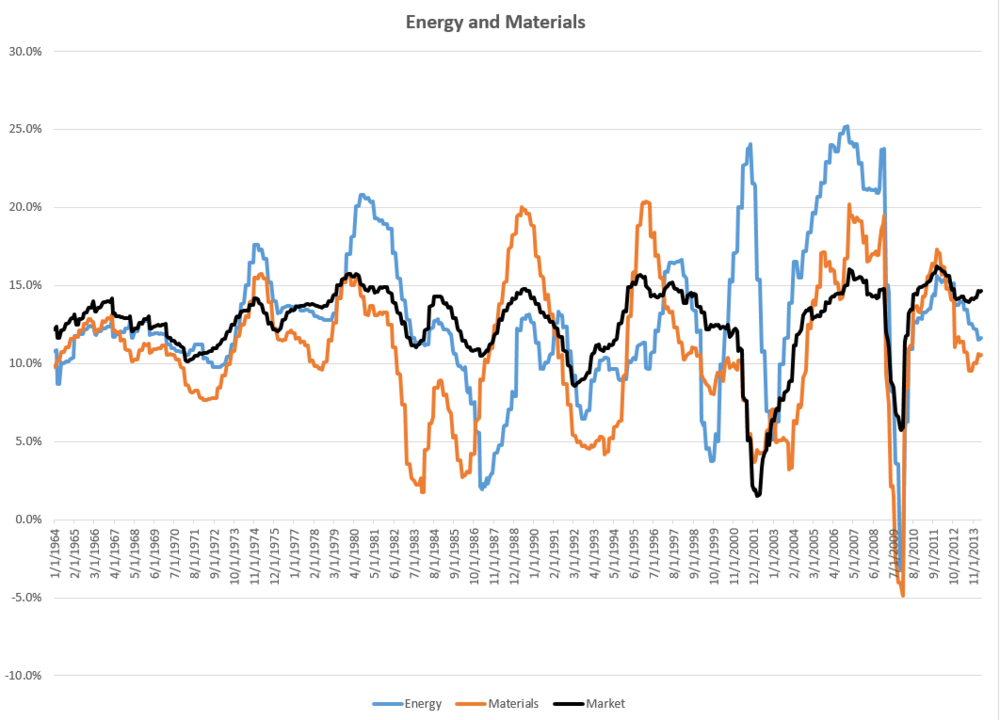
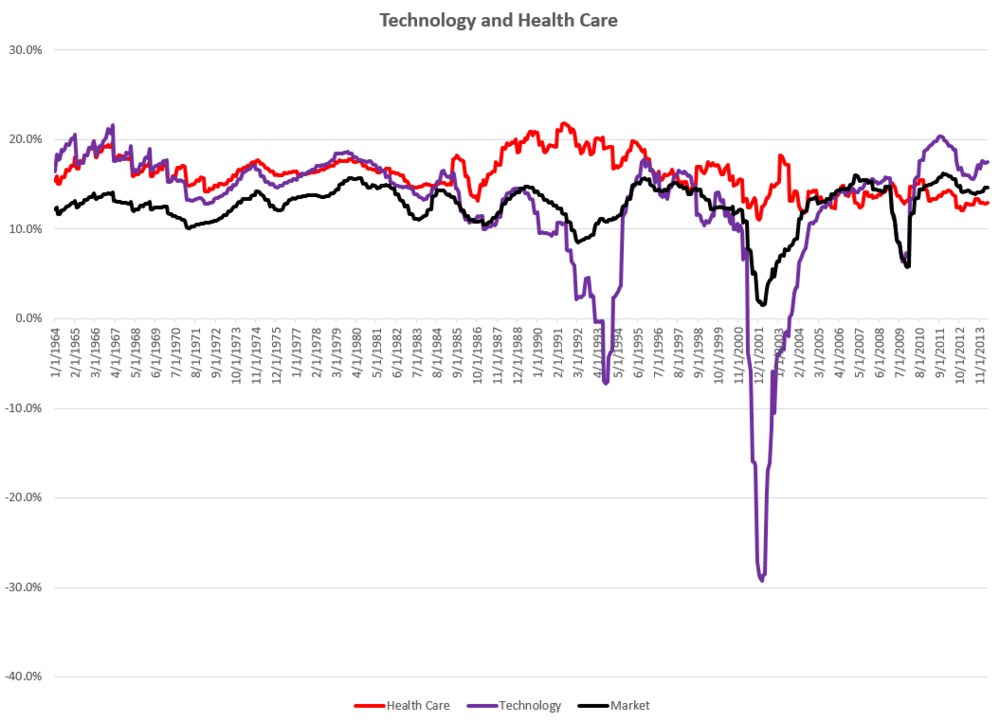
ROE mean reversion is much more pronounced in some sectors than in others. Here are a few examples.
Current ROE levels are high but well within reason based on historical averages and market cycle peaks. This paints a much different valuation picture than the popular profit margin chart (corporate profits/GDP) that bears are fond of citing (seen at left below). ROE reversion will no doubt continue in future market cycles as it has in the past—nothing appears to be that different this time.
Some calculation notes: ROE by market and sector is a simple comparison of total annual net income to total common equity. The universe is all U.S. domiciled stocks with an inflation adjusted market cap larger than $200MM since 1964. I exclude financials and any securities for which I am missing either net income or common equity data. I also exclude companies with negative common equity.
Hi,
Thanks for the interesting and informative post. Can I ask how you calculated the ROE’s? It seems like it says at the bottom that you calculated stock by stock? I’m not even sure how you would begin to do that, but I’ve been looking for book value data on the S&P 500 for a while and have been having some trouble finding it.
All I’ve found is a paper from 1995 with some values since 1956 that are a bit different than yours but largely the same. Any guidance would be very much appreciated.
Thanks,
Kyler