Book to price is a bad value factor. It is a decent stock selection factor overall, but relative to the other ways of measuring value (earnings to price, cash flow to price, EBITDA/EV, etc) it is sub par.
I’ve been interested lately in very concentrated value portfolios, and found it interesting that when running very small portfolios (as little as 1 stock selected per month, with an annual holding period) based on book/price, you wouldn’t have done very well (and would have lost money in the one stock versions!)
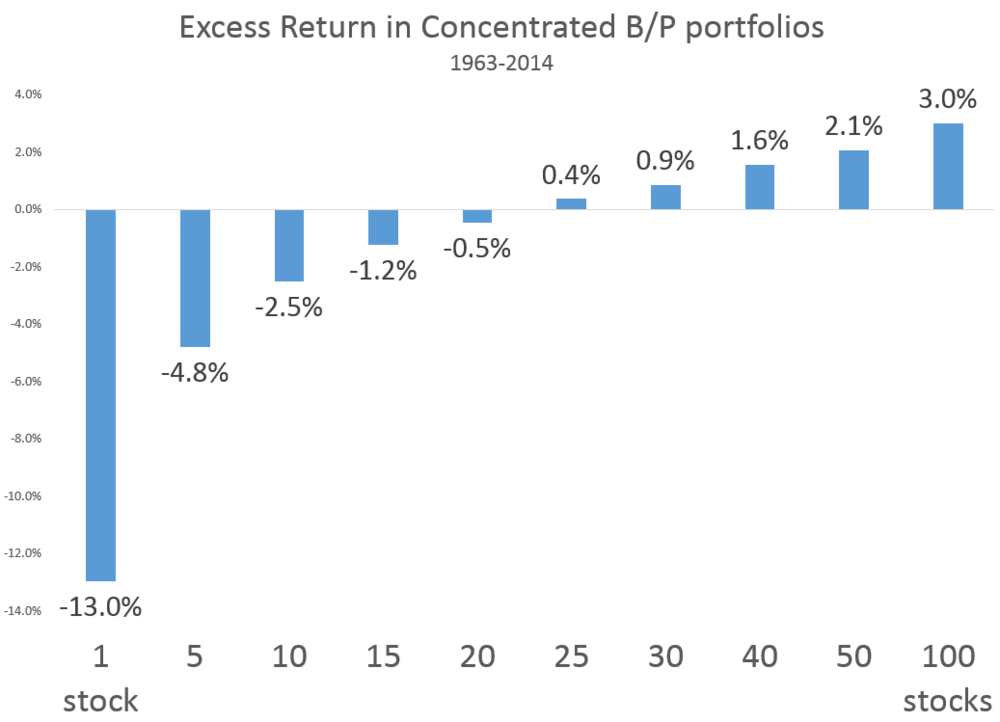
Here are the absolute and excess returns for concentrated book/price portfolios since 1963. It is not until you get to 25 stocks that the return of the concentrated portfolio edges out the market’s average rate of return (11.45% in this period). I also ran concentrated portfolios of the most expensive stocks by book/price and was very interested to find that for the 5 and 10 stock versions, the expensive portfolios outperformed the cheap ones (barely, but still)! Once you get to larger baskets of stocks, then things normalize and cheap beats expensive.

Let’s consider the 5-stock version as an example (which underperforms the equal-weighted market by nearly 5% per year). Below are the rolling 3-year excess returns for that portfolio: consistently bad with occasional periods of brilliance.

These stocks tend to be very different from other value stocks. The 5 cheapest stocks at the end of 2014, for example, failed to crack even the cheapest 1/3 of all stocks as measured by a composite value score (e/p, fcf/ev, ebitda/ev, s/p, shareholder yield). Four of the five have negative earnings, so look very expensive by other measures.
Unlike with other value factors, these results suggest that you do NOT want to own a very small basket of stocks that are only cheap based on this mediocre measure of value. Stick to other value factors instead.
/rating_on.png "1 Star")
Thanks for the interesting blog post.
From recently reading "Deep Value" I am intrigued by the issue of concentration vs. diversification of "value" portfolios. Montier’s study of "net net" portfolios suggests any one individual stock has a higher probability of permanently impairing ones capital whilst a portfolio of them has significantly outperformed the market over time.
Is there a more appropriate strategy of factors to follow given a concentrated portfolio vs. a diversified portfolio?
Why is there such a difference?
Thanks for a great blog.
All the best,
Mike
So your 5 stock portfolio would be the 5 cheapest stocks in the market by price:book? Or a random sampling of 5 of the cheapest stocks (by quintile/decile/whatever)?
Interesting! Just wondering what would the results look like if only high f-score stocks were included (to weed out the distressed companies)..
Very interesting and thoughtful information.
A quick glance at the graph showing the 5 stock B/P portfolio’s rolling three year excess returns seems to indicate that its excess return has occurred during bear market periods. The bulk of the excess return happened during the 70’s, early 90’s, early 00’s, but some also happened during the early 80’s and late 00’s. Though it’s not a perfect correlation (e.g. the market fell during the recession of ’92 and between between ’00-’02, shorter periods than the portfolio’s excess return around these times; also the crash of ’87 isn’t reflected in the graph), those periods seem to coincide with times of economic stagnations and bear markets. Am I reading too much into this or does a concentrated B/P value portfolio work best, or in fact only at all in light of your post, during bear markets?
It would be very interesting to see you run all the value multiples through this sort of test, to see which work better to form concentrated or wide portfolios. Just a little wish from an interested follower of your blog. 🙂
Great post. P/B is a flawed metric. Academics love it and so do many smart beta/factor based strategies because it has relatively low turnover relative to other value metrics.
You can find an interesting comparison of the performance of various value metrics on my blog - http://www.marketfox.org
http://marketfox.org/2014/11/11/screening-for-value-what-works/
That’s interesting, but I wonder how many stocks were in the universe from which the cheapest stocks were chosen. The charts show results for choosing up to 100 of the cheapest stocks. If the universe were 1000 stocks then the 100 cheapest would represent the cheapest decile. If the universe were 500 stocks then the cheapest 100 would represent the two cheapest deciles.
As thoroughly explained in "what works on Wall Street", James O’Shaughnessy shows that, for optimum results, several measures of "cheapness" should be used (P/E, EV/EBITDA, P/S, P/CF, etc.). Actually, as it turns out, P/B is not a reliable indicator of cheapness relative to "normalized" value.
yes, I am quite familiar with that book 😉
the universe is about 3500 stocks today, closer to 1000 back in 1963