Cheaper stocks have outperformed the market – Everyone
As I write and think about “factor investing,” I worry about what Aruther Koestler called the “struggle against the deadening cumulative effect of saturation.” Value investing was revolutionary when Graham was writing about it, and was still fairly revolutionary when Fama/French, Lakonishok, and-shameless plug-Jim O’Shaughnessy (among others) were exploring it in the early 1990’s. Today, it is an overly saturated concept. Everyone wants a value tilt which of course is a catch-22 because if everyone tilts towards value, value stocks will stop being value!
Still, while value is a well-covered topic, it is still a bedrock principle for successful active managers that requires a lot of our attention in this Field Guide. As we will see in future posts, the real opportunity in factor investing is the application of factors to build portfolios which are more concentrated than a typical “tilted” market portfolio.
In exploring value, we will start with the OG value factor: price-to-book.
Book value (or “common equity” calculated as total assets minus total liabilities) has some advantages. Unlike earnings, it is fairly stable through time and almost always a positive number. This makes calculation easy and leads to lower turnover in a live value portfolio based on price-to-book. Many famous style indexes and money managers use price-to-book to define value.
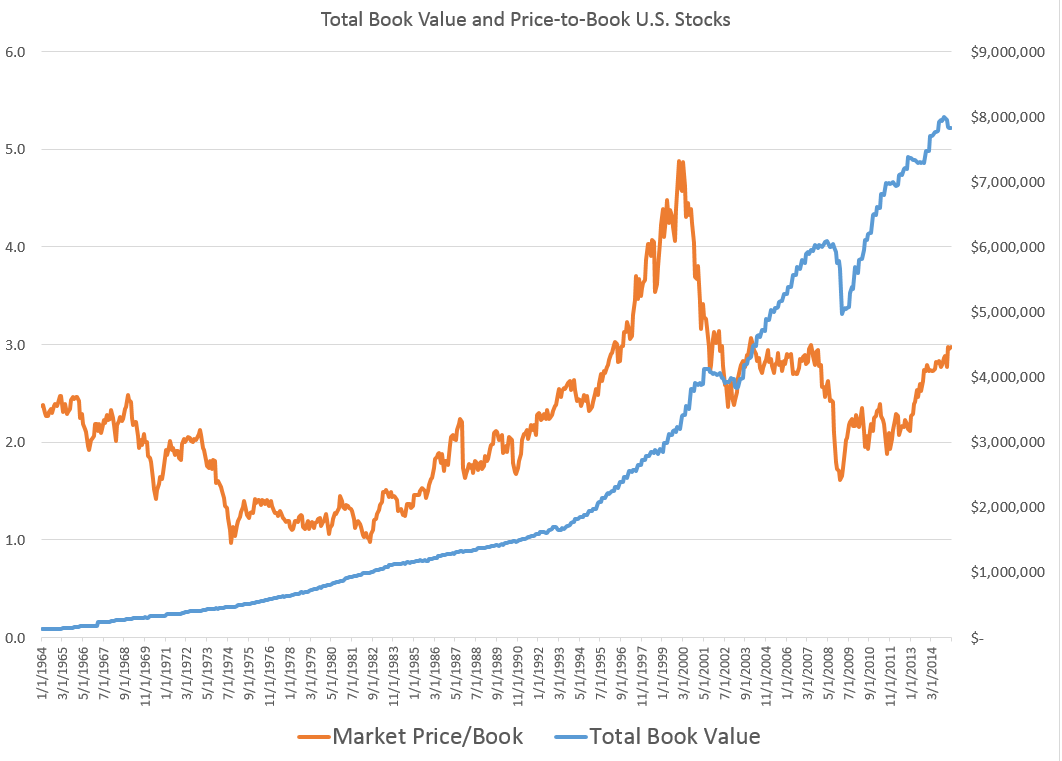
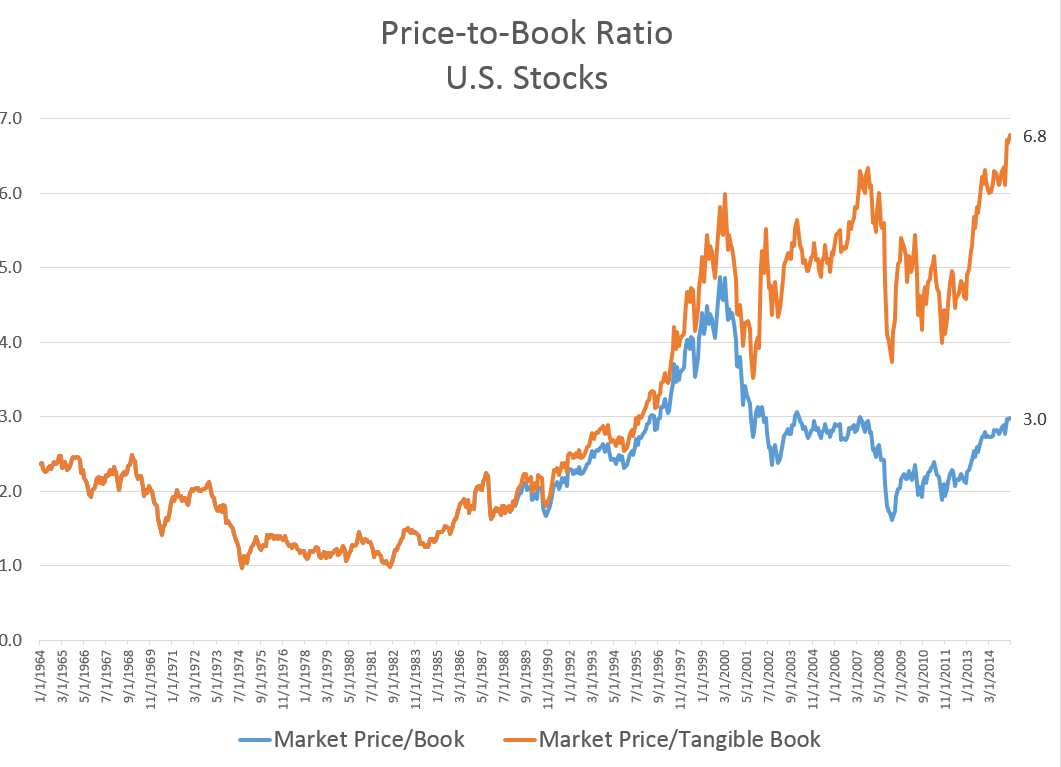
Here is the total book value of U.S. stocks and the overall, market level price-to-book ratio for U.S. stocks since 1963. There hasn’t really been a “normal” price-to-book ratio, as it’s ranged widely between 1x and 5x. It is amazing that the market traded at book value twice (in 1974 and 1982) given that the market’s common equity was still very productive: the market’s return on equity was above 13% both times and was stable.
Price-to-book ratios are also quite spread out by sectors, seen below:
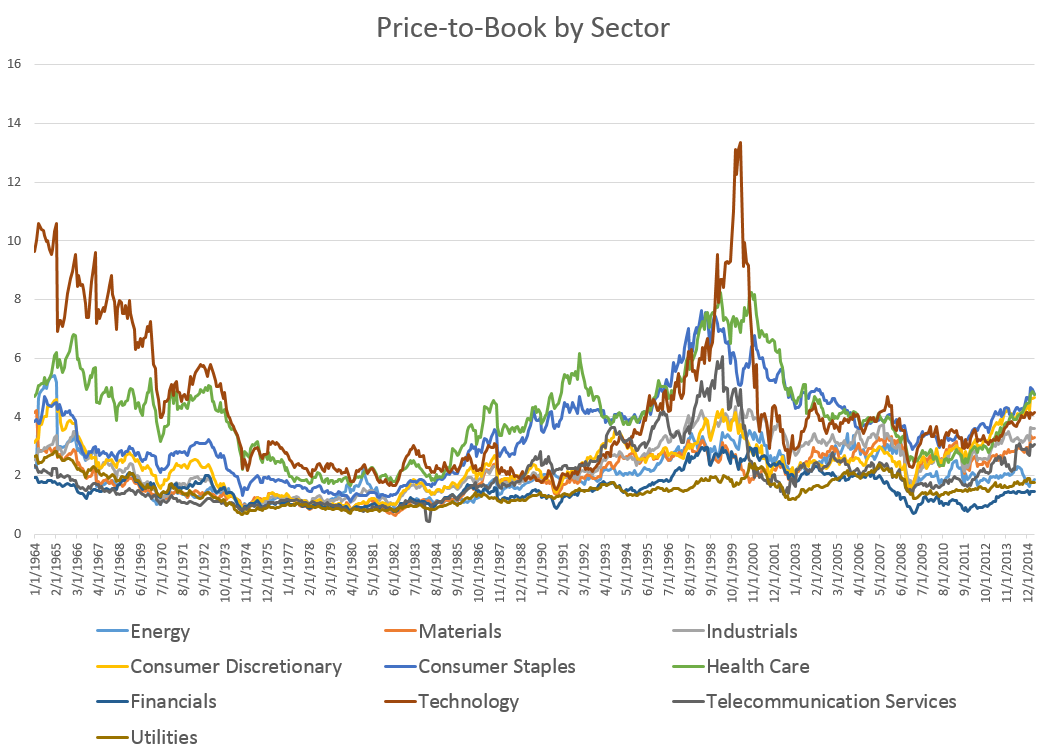
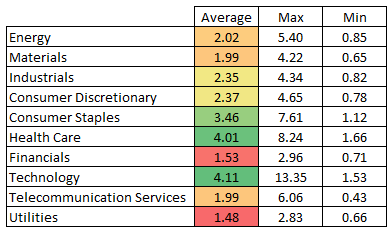
Here is an average, max, and min price-to-book for each of the ten sectors since 1963. Clearly, some sectors have structurally higher ratios.
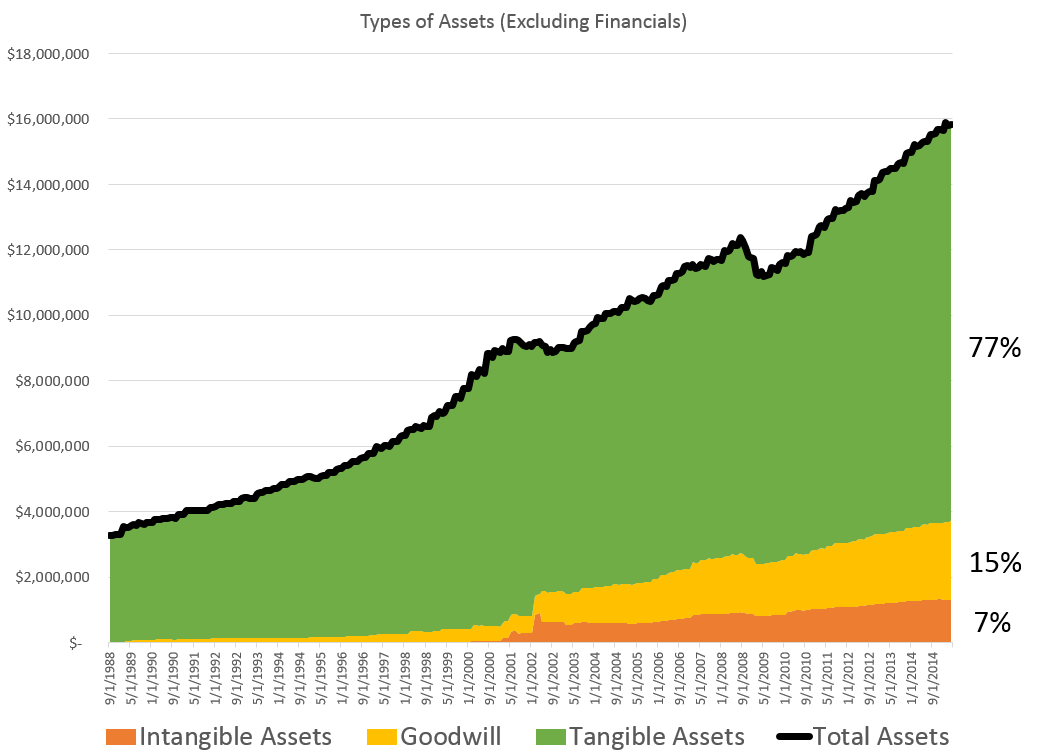
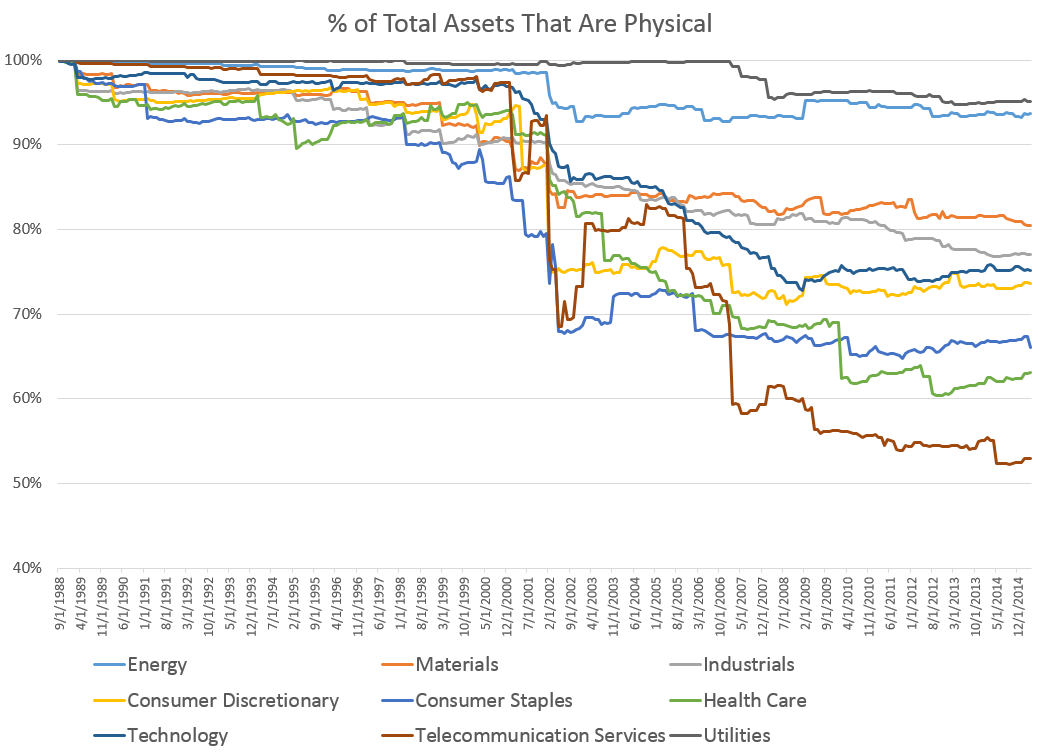
Book value used to be referred to as liquidation value: if you went out of business, book value gave you a sense for how much would you have left over if you sold all your stuff and then covered your liabilities. But the nature of that “stuff” has changed. It used to be mostly psychical stuff (e.g. property, equipment), now a sizable chunk of assets are “intangible,” or non-physical stuff (e.g. patents, brands, client lists, goodwill, trademarks, etc). Today, nearly one fourth of all assets owned by U.S. companies are intangible.
A very different picture emerges when you calculate price-to-tangible book value (where tangible book is total book value minus goodwill and other intangibles). Granted it is unfair to remove a chunk of assets without removing any liabilities, but I still find the comparison interesting.
For some sectors today, intangible assets represent more than 50% of total assets. Check out the progression since 1989, when data on goodwill and intangibles first become available. Some sectors, like telecom and health care, carry huge amounts of goodwill and intellectual property.
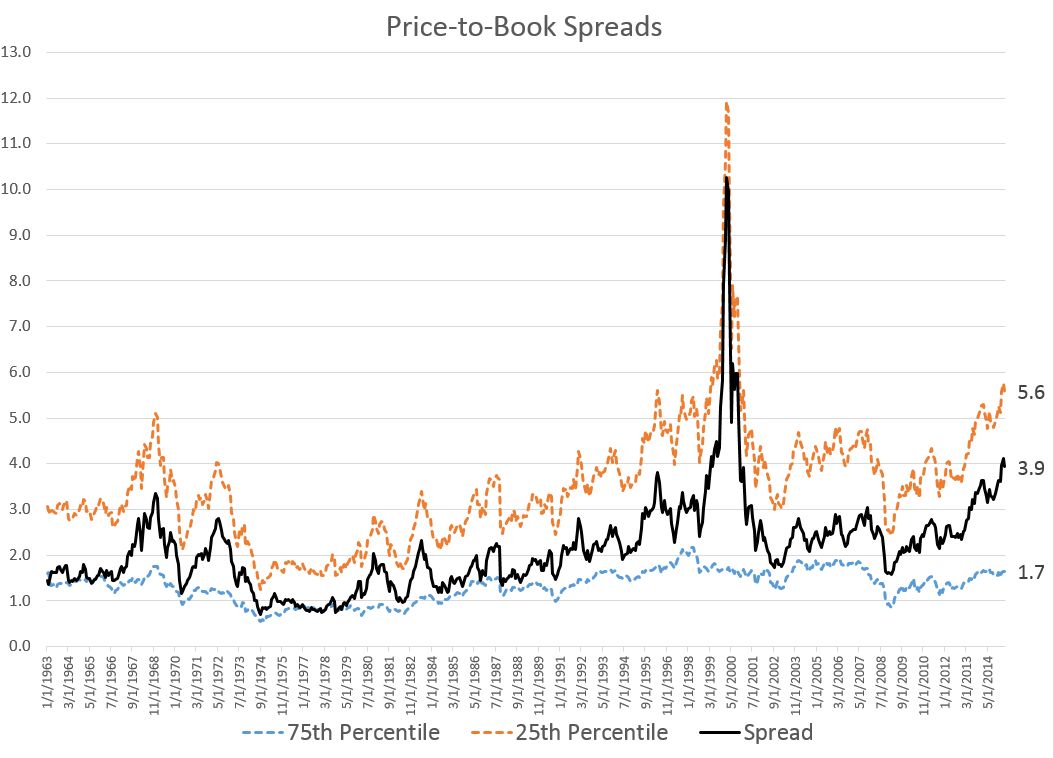
One final interesting note: the spread between cheap stocks and expensive stocks (based on p/book) has been rising in recent years. The price-to-book ratio for stocks in the most expensive 25% (75th percentile) has risen from 2.4x in February 2009 to 5.6x today.
***
We should be equally excited and worried that factor investing—which I’ll define as buying a basket of stocks based on proven metrics like value and momentum, rather than buying them because of fundamental research—has become the rage. Excited because it has—historically—been a superior way to invest. But worried because as Yogi Berra said of some restaurant’s popularity, “nobody goes there anymore, it’s too crowded.” We will continue by examining the relative merits of price-to-book as a stock selection factor in detail, and we will try to assess the “popularity” of each factor to see which factors the market may still be ignoring. Stay tuned.
/rating_on.png "1 Star")
/rating_half.png "5 Stars")
Very nice post.
BTW, with leverage, there is no reason book value (or especially tangible book value) even has to be positive. Around a quarter of S&P 500 firms have negative tangible book value, and thus for these firms “market price/tangible book value” is a weird ratio.
I blogged a bit about these trends a few weeks ago:
http://3rdmoment.blogspot.com/2015/03/whats-driving-trend-towards-intangible.html
Hello, I was wondering how did you obtain price-to-book data for the entire US market back to 1963. Bloomberg and other sources I found for the S&P500 price-to-book only start from 1990. Thanks! Oksana