Bill, Ernie and Sam—three lifelong value investors—met in a bar on November 30th, 2015.
Bill was despondent. He’d underperformed the market by -47% over the past 10-years and was questioning his very belief in value.
Ernie was happier. He’d done poorly in 2015, but over the last ten years he’d outperformed the market by +19%.
Sam offered to buy the next round. He’d outperformed by +52% in the past 10 years, and was looking forward to the next 10 as a contrarian value investor.
All three had the exact same investing methodology: buy the cheapest 10% of the market every year, and hold for a year. Each of the three also selected from the exact same list of U.S. stocks[i]. The only difference was how they measured value. Bill used book value, Ernie used earnings, and Sam used sales.
If a few more friends joined them—who used EBITDA, or free cash flow, or operating cash flow, or total yield—Bill would have remained the only despondent value investor. All of the other factors have either broken even or outperformed the market over the past decade[ii].
But there is no “benchmark” for a value strategy which buys the cheapest 10% of stocks by price-to-sales and weights them equally. Instead, when evaluating whether or not value has worked, we use indexes which are 1) based mostly on price-to-book and 2) are market cap-weighted. And sure enough, the Russell 1000 Value has underperformed the Russell 1000 by -22% and the Russell 1000 Growth by -43% over the past decade (10 years ending 11/30/15).
Because most can’t do better than reference these large indexes (which is no fault of theirs), the market narrative has been that value has stunk. Investors still have $27.5 billion dollars invested in the price-to-book dependent Russell 1000 Value ETF ($IWD). Lots of people feel Bill’s pain.
Continuing our comparison from above, here is the rolling 10-year excess return earned by our three value investors over their investing lifetimes.
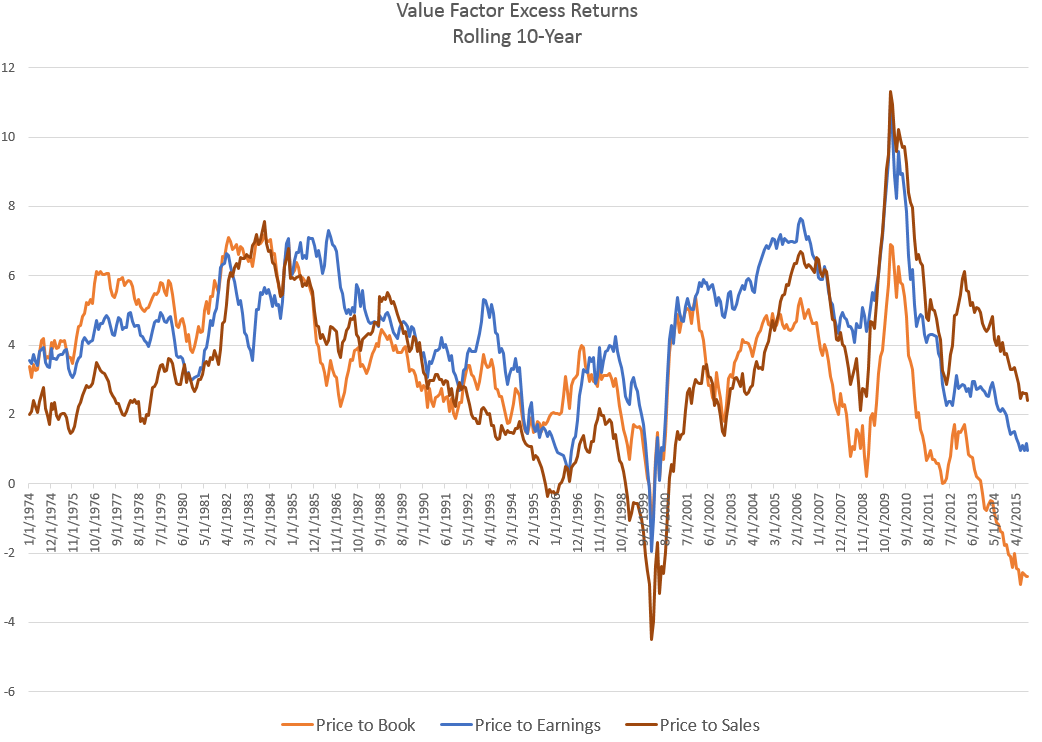
This 10-year period is the worst since 1964 for price-to-book, but it’s not the worst for any of the factors. Price-to-sales had a worse period culminating in 2000, a period during which Sam would have underperformed by 4.5% per year for ten years.
****
A quick aside: can you imagine sticking with a strategy that has lost by that much for 10-years? No asset management business would survive it. No intermediary acting on the behalf of an end investor (be it a financial advisor or pension plan sponsor) could continue to recommend such a strategy after such a long period of weak period of results. At the end of such a run, the portfolio manager him- or her-self would be indistinguishable from a dope, idiot, or moron[iii]. Quarterly performance reviews have had a profound impact on investing strategies and on the investing business.
****
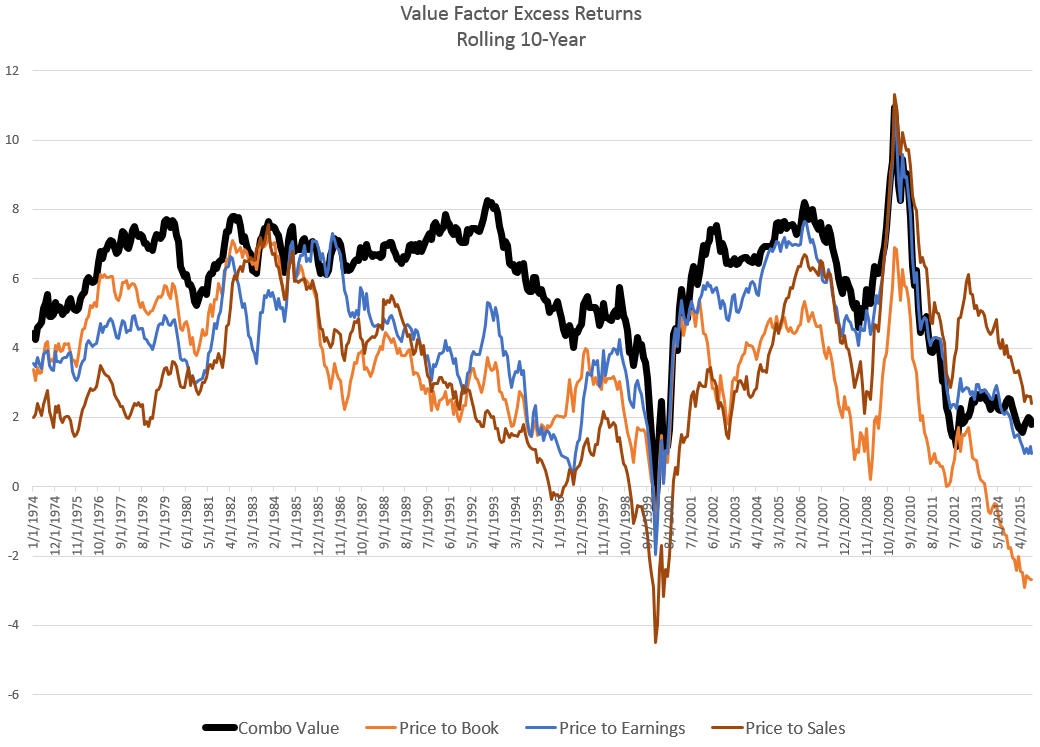
Value-, Momentum-, and Quality-based strategies are now commonplace. Even passive/index proponents have sung their praises. I hope that this simple story about different types of value encourages a deeper investigation of these broad concepts. There are lots of ways of measuring value, or momentum, or quality. The definitions you choose can lead to very different results, even over 10+ year time frames. A balance of factors is likely best. Here, for example, is the same chart as before, but now including a “composite” value factor which looks at sales, earnings, EBITDA, free cash flow, and total yield. The results have been smoother, and better.
[i] Everything with a market cap above $200MM, adjusted for inflation back in time
[ii] My benchmark is an equal weighted market return, the opportunity set from which these investors can select their stocks.
[iii] I am generalizing A BIT here, of course there are some with a truly long view, but they are few and far between
/rating_on.png "1 Star")
/rating_half.png "5 Stars")
Typo: should be “now including” I think
fixed thank you
Excellent observations and summary, thanks for sharing. The additional piece that strikes my eye from the charts is the amazing (to the eye) underperformance of value during the bull runs of the 90s and from 2009 to date. Perhaps the tide will turn for value stocks again (indeed perhaps even by price-to-book measure). Or another way to ask a question here is: what is wrong with our “book” measure? It seems to me there should be a way to cook this book to make it more meaningful to value investors.
Only one question: Your performance chart, the different series, they don’t all start at the same point, why not?
surely its not correct to say x performed better than Y if they don’t start at the same point?
Jacques, that’s because they are rolling 10 year returns and not portfolio levels (or AUMs). They would be different for different strategies.
Having said that, I’d like to look at the portfolio levels as well.